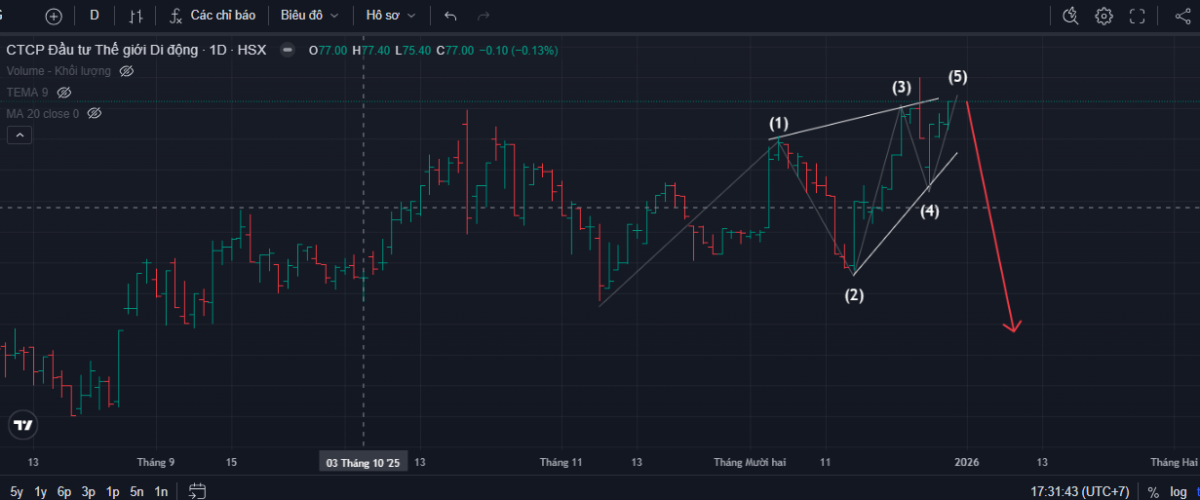
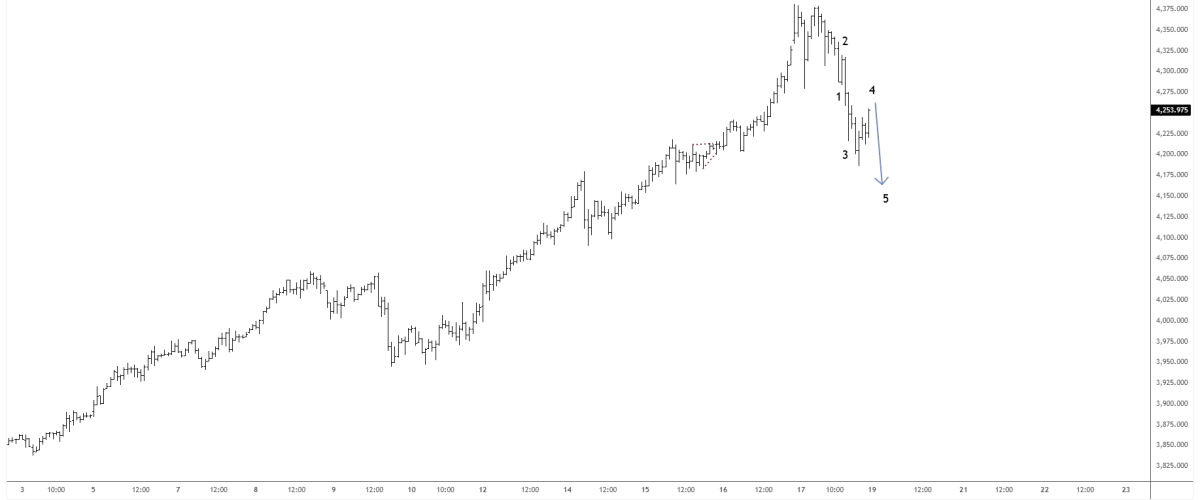
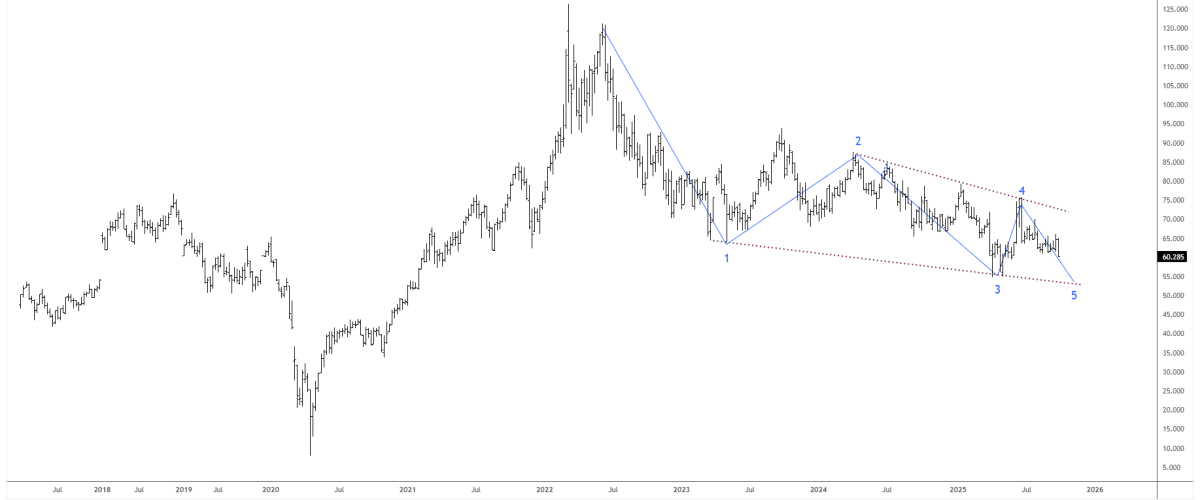
The wave structure suggests that BTCUSD may still have an upward phase in its 5-level cycle, while Gold could resume its uptrend if price is contained above $4,285 USD/oz. Oil prices may continue to correct in Q1 2026 before a strong recovery. Elliott Wave chart of Gold (XAUUSD) Elliott Wave chart of BTCUSD Elliott Wave...
Chart counting the wave patterns of the VN-Index and MWG-FPT stocks.
Elliott Wave Counting for the VN-Index The VN-Index is rising in a Wedge pattern, while Elliott Wave theory suggests an Ending Diagonal pattern. Many stocks have entered a distribution phase. Investors should be cautious about the possibility of a sharp decline following the ED pattern. Elliott Wave Counting for MWG stock Elliott Wave Counting for...
Elliott wave analysis of Gold,VN-Index, VN30 Future week of 10/20-25/2025
Gold: Potential to have more downside 4,140-4,160 (wave 5) Gold fell sharply from the 4,380 USD/oz area and has an impulsive wave structure. The recovery structure of wave 4 is a Flat wave, so it is forecasted that in the week of October 20-25, 2025, there will be a further decline to the center of...
Bitcoin Crashes, Will Gold and Stocks Follow?
To answer this question, I have been monitoring the Gold and VN-Index charts for quite some time, and I observe that the Elliott Wave structure of both XAUUSD and VN-Index are at the end of their upward waves VNINDEX: Completing the 5-Wave Elliott Wave Structure As shown in the image, VNINDEX has completed its 5-wave...
FX Investment Opportunities for the Week of 06/10/2025: Gold, Oil, and VN-Index
XAUUSD Gold Price Following Elliott Wave Ending Diagonal: Sell at 1897-1900 and Retrace Gold has formed an Elliott Wave pattern called the Ending Diagonal, which occurs at the end of a trend and forecasts a price decline. This pattern will be confirmed if the price rises to 1897-1900 and then retraces. Strategy for the upcoming...